.png?width=357&height=85&name=tpiq-logo%20(375x85).png "TaxPlanIQ")
/Scenario%20Modeling.webp)

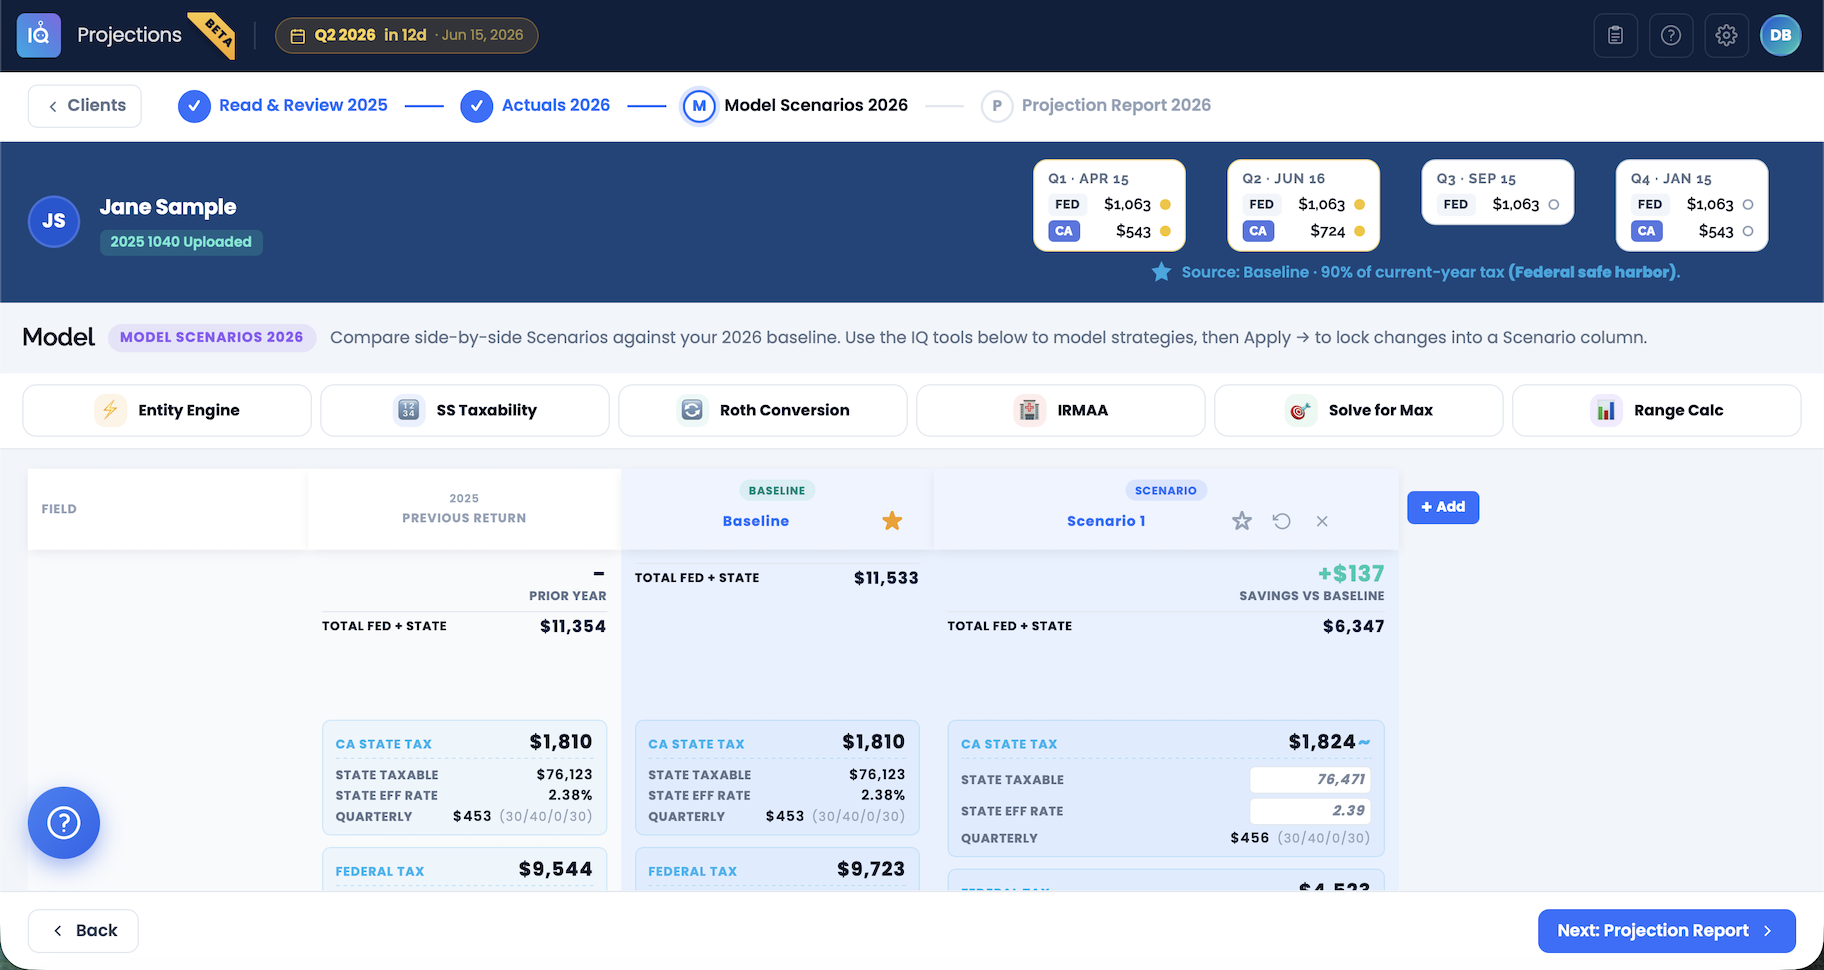
Model any scenario, live.
Run up to 5 tax scenarios side by side with calculations that update in real time. When a client asks "what if we do this?" you have the answer before they finish the sentence.
- Compare unlimited scenarios simultaneously
- Live-updating calculations as you adjust any input
- Model income changes, deductions, retirement elections, and capital gains events
- Save and label scenarios for client presentation
/Entity%20Engine.webp)
Model an S-Corp Election.
The Entity Engine runs a comparison if your client elects an S-Corp with federal and state tax outcomes for each.
- Side-by-side federal and state tax results for all four entity types
- Accounts for self-employment tax, reasonable compensation, and pass-through income
- Shows net after-tax difference between structures in plain numbers
- Runs in seconds from existing client data, no re-entry required
/Roth%20Conversion.webp)
Show the real cost of converting and the real savings.
Model Roth conversions across multiple years with bracket-aware analysis. Clients see exactly what a conversion costs today against what it saves over time, so the decision becomes clear.
- Year-by-year tax cost breakdown at each conversion amount
- Accounts for impact on Social Security taxability and IRMAA exposure
- Side-by-side view of convert vs. hold outcomes over time
- Adjustable conversion amounts to find the optimal fill point
/IRMAA.webp)
Catch the cliff before your client crosses it.
Calculate Medicare IRMAA surcharge exposure based on projected MAGI. The calculator surfaces clients approaching income thresholds so you can act before the surcharge kicks in, not after.
- Projects MAGI against all current IRMAA income thresholds
- Shows exact surcharge dollar amount at each bracket level
- Flags clients within range of a cliff during projection review
- Factors in Roth conversions, capital gains, and other income events
/SS%20taxability.webp)
Project exactly how much of Social Security gets taxed.
The SS Taxability Calculator projects the portion of a client's Social Security benefit subject to federal income tax based on their combined income. Essential for any client managing distributions in retirement.
- Calculates the taxable percentage of Social Security benefits
- Accounts for combined income including IRA distributions and investment income
- Shows the tipping points where more income triggers more benefit taxation
- Integrates with the broader projection for a complete retirement tax picture
/Solve%20for%20Max.webp)
Work backwards from the outcome your client wants.
Set a target tax liability and let Solve for Max calculate what income level, deduction, or contribution gets the client there. Instead of projecting what they owe, you're engineering what they want to owe.
- Enter a target liability and the tool solves for the required input
- Works across income adjustments, deductions, and retirement contributions
- Ideal for year-end planning conversations where the goal is a specific number
- Pairs naturally with scenario modeling to validate the path to that number
/Range%20Calc.webp)
Model an entire income range in one view.
For clients with variable income, business owners, commission-based advisors, or anyone with an unpredictable year, the Range Calculator shows tax outcomes across a full income spectrum rather than a single point estimate.
- Set an income range and see tax liability at every point along it
- Identifies bracket crossings and cliff points visually
- Particularly useful for business owners projecting a range of revenue outcomes
- Gives clients a realistic picture when income is genuinely uncertain
/Safe%20Harbor.webp)
Know who's at risk before the deadline, not after.
Safe Harbor Tracking monitors each client's estimated payment status against IRS safe harbor thresholds, 110% of prior year or 90% of current year liability.
- Tracks safe harbor status for every active client automatically
- Calculates required quarterly payment amounts to stay compliant
- Surfaces underpayment risk alerts before each quarterly deadline
- Flags clients with income growth that may affect current-year estimates
From tax return to client deliverable in four steps.
Every projection follows the same repeatable process: Read, Actuals, Model, Projection. Consistent, fast, and built to scale across every client in your book.
Upload a 1040 from any tax prep software.
Drop in a prior-year return and our AI engine does the work. Income figures, filing status, deductions, and entity details are extracted automatically and ready to model.
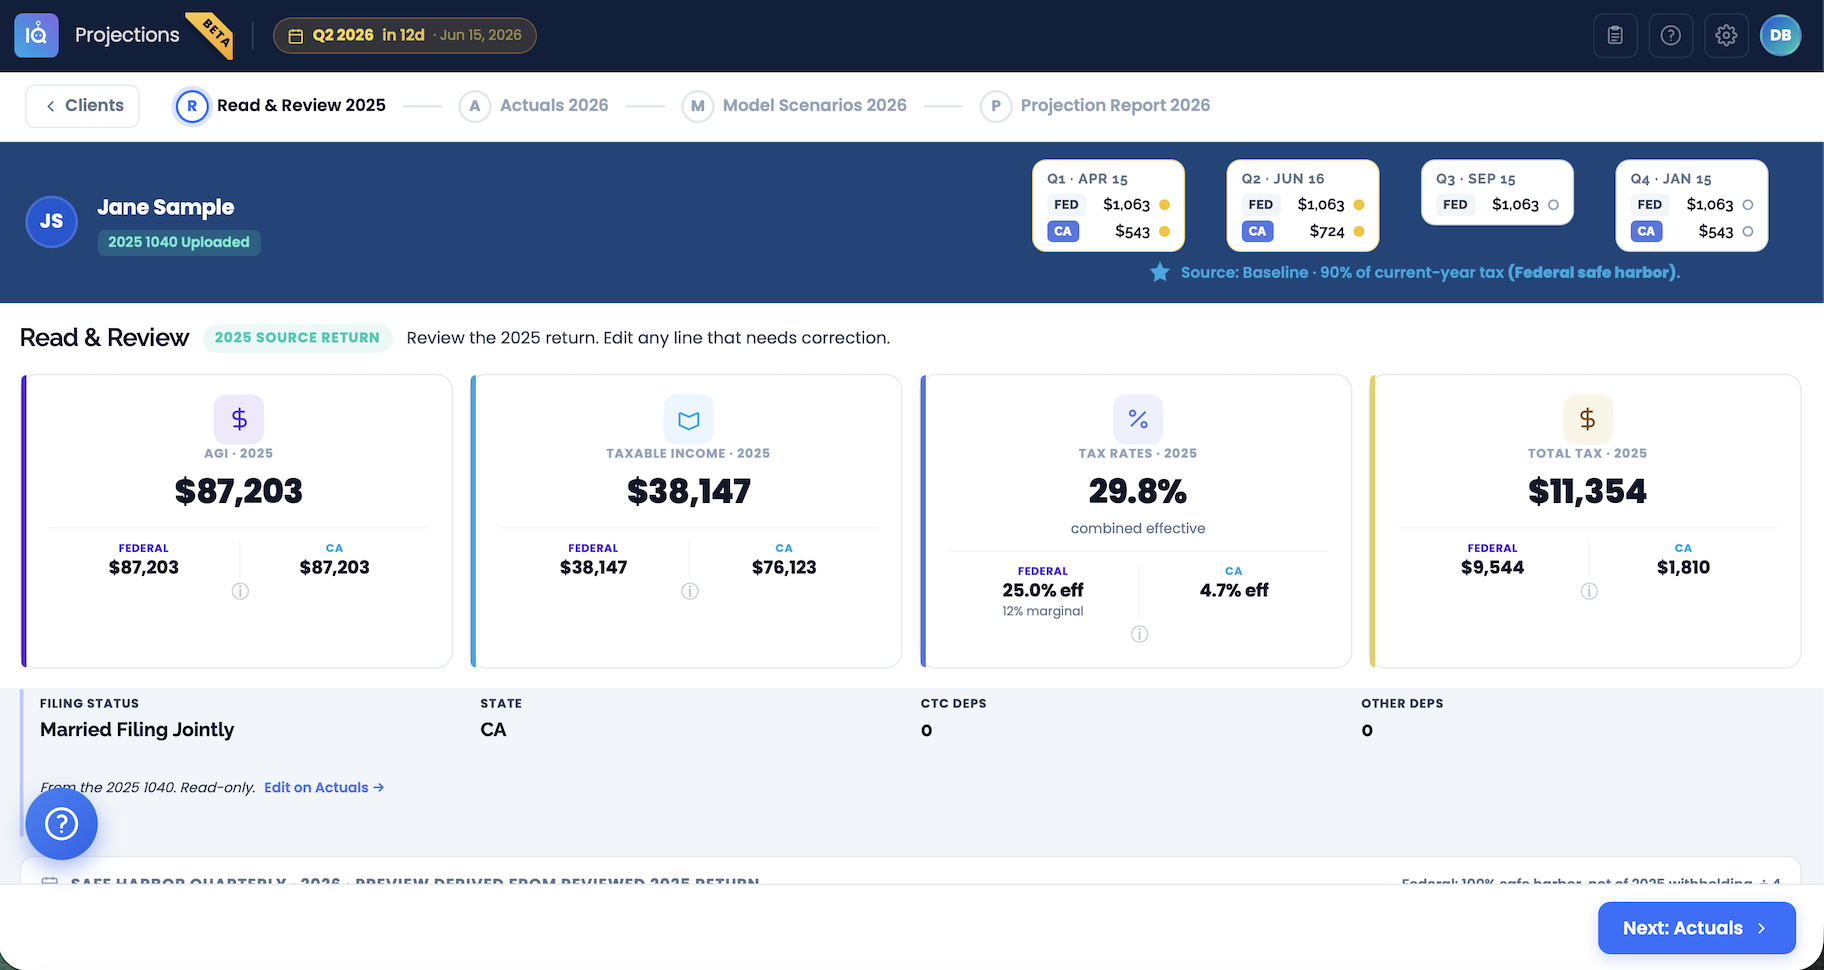
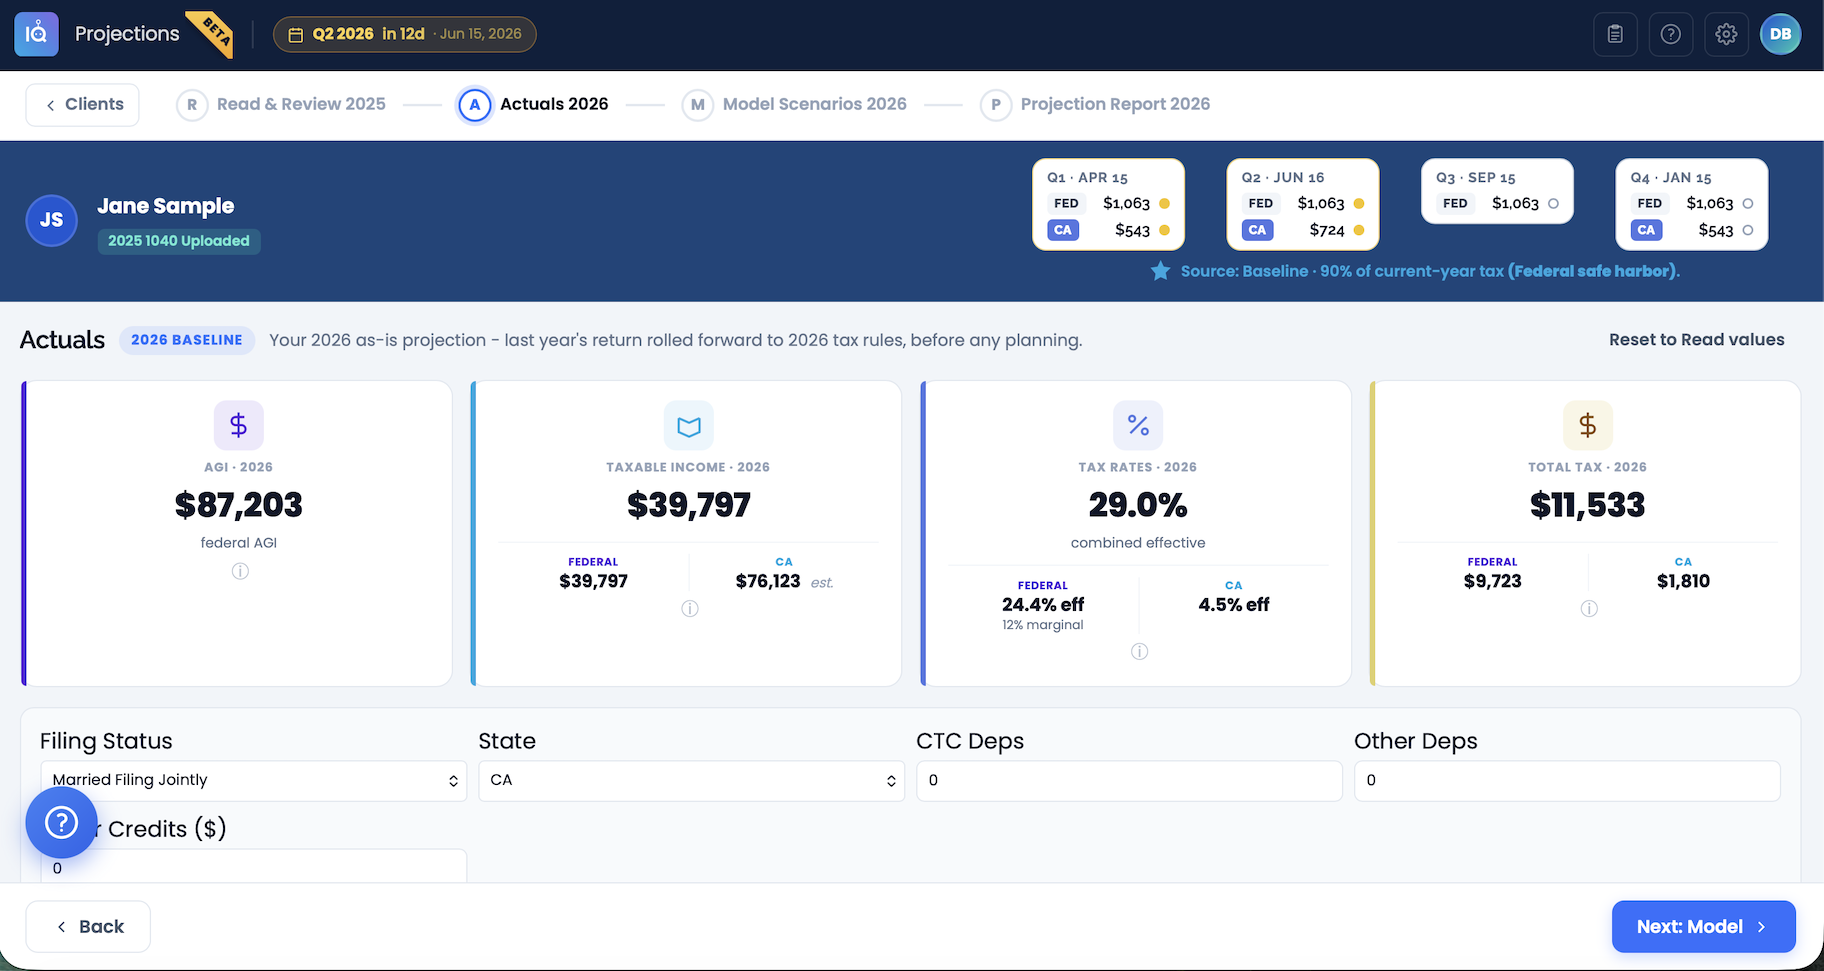
See exactly where the tax is coming from.
The Actuals step breaks down the full picture: income composition, bracket waterfall, effective vs. marginal rate, and quarterly estimate status. Every number in context before a single scenario is run.
Run scenarios. See outcomes update live.
Build up to 5 side-by-side scenarios and every calculation updates in real time. Adjust income, entity structure, retirement contributions, or capital gains events and every change recalculates across all scenarios simultaneously.
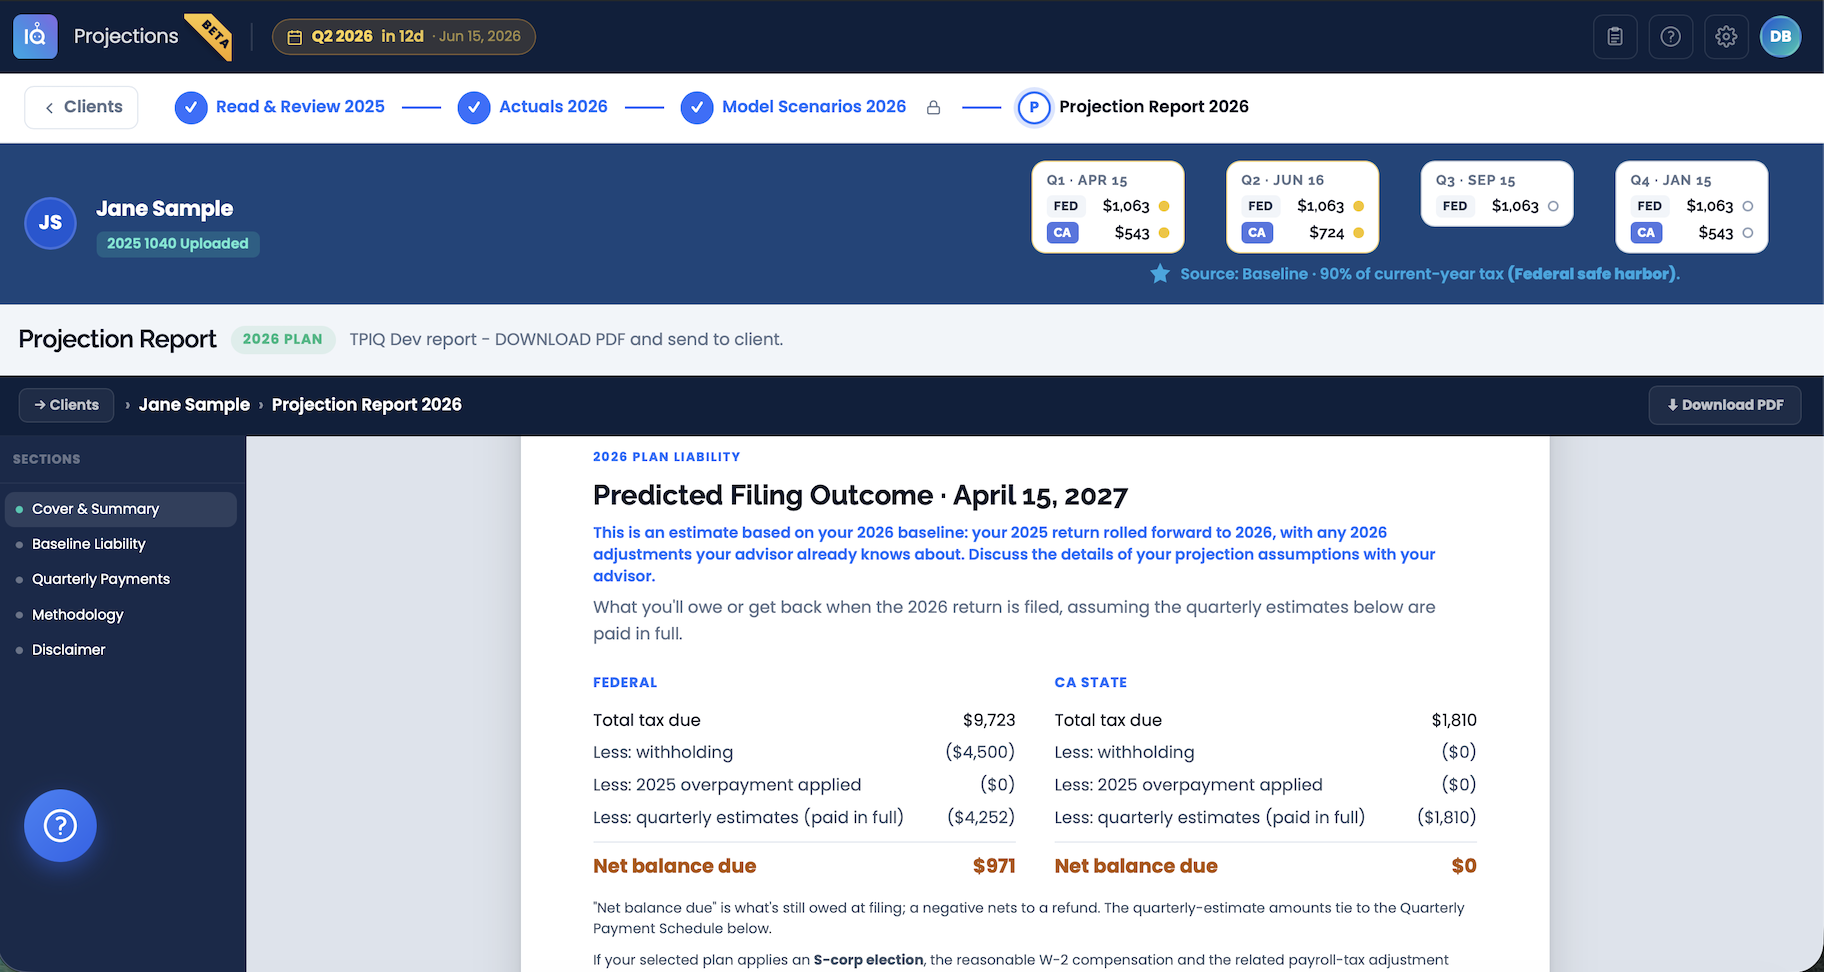
A branded report, ready to send.
Generate a white-labeled client report with projection charts and quarterly estimate schedules.